Aggregate Supply and Aggregate Demand on a Price/Output Axis
1) Draw a generic Aggregate Supply (AS) and Aggregate Demand (AD) curve on a set of axes. Label your vertical axis and your horizontal axis appropriately and indicate where the macroeconomic equilibrium is.
2) Then find a current events article that discusses some macroeconomic event that will affect either AS or AD. Represent this effect using a rightward or leftward shift as appropriate.
3) Use your model to interpret the effect of the event from your article or scenario on the price level, output, and unemployment for the relevant economy.
0
(0 Ratings)
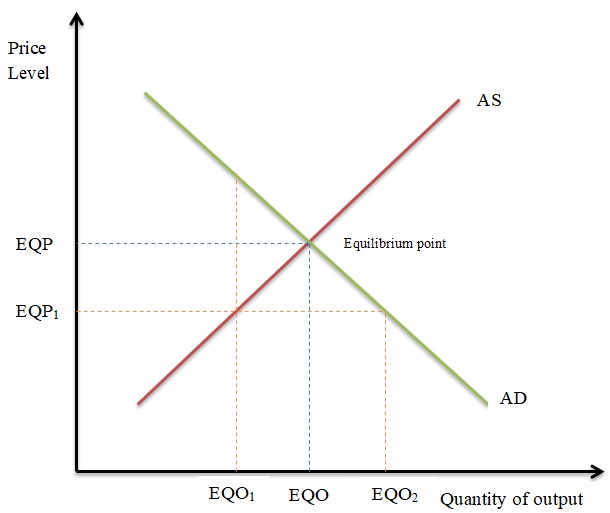
Note: In the illustration above, EQO = equilibrium output, EQP = equilibrium price, AS = aggregate supply, AD = aggregate demand, and AS = aggregate supply.
The event in consideration and the shift it causes is the war by Russia in Ukraine. As a major player in the global economy, production in Russia will go down, pushing a lower supply against a higher demand. The shift in aggregate supply will force the prices higher, as the market seeks a balance between demand and supply. On the other hand, demand will rise far beyond what the suppliers can afford to offer. The market’s actual demand will be at EQO2, whereas the suppliers can only facilitate the supply of output at EQO1. The market’s equilibrium is at the point between the two output levels, and it is where demand and supply balance to ensure a fluid market. With the decrease in supply and a strained demand, the rate of unemployment is likely to rise, and the disposable income among the people is likely to reduce. It is a balance only likely to be struck only when market forces naturally balance out in the future.
In this thought-provoking response, the author's perspective is skillfully backed by an extensive body of comprehensive research and readily available information, offering a well-informed and compelling exploration of the subject matter.
Assess GDP's importance. Examine the shortcomings of GDP in measuring a country's economic health? Discuss using GDP to evaluate the business cycle. Examine factors that may affect the business cycle. Evaluate the health of the current U.S. economy by its GDP, business cycle, and economic growth.