Example of Calculating NPV Probability Using Crystal Ball Simulation - Project Management
A manufacturing firm has set up a project for developing a new machine for one of its production lines. The most likely estimated cost of the project itself is $1 million, but the most optimistic estimate is $900,000 while the pessimists predict a project cost of $1,200,000. The real problem is that even if the project costs are within those limits, if the project itself plus its implementation cost exceed 1,425,000, the project will not meet the firm’s NPV hurdle. There are four cost categories involved in adding the prospective new machine to the production line: (1) engineering labor cost, (2) non-engineering labor cost, (3) assorted materials cost, and (4) production line down-time cost.
The engineering labor requirement has been estimated to be 600 hours, plus or minus 15% at a cost of $80 per hour. The non-engineering labor requirement is estimated to be 1500 hrs., but could be as low as 1200 hrs. or as high as 2200 hrs. at a cost of $35 per hour. Assorted material may run as high as $155,000 or as low as $100,000 but is most likely to be about $135,000. The best guess of time lost on the production line is 110 hours, possibly as low as 105 hours and as high as 120 hours. The line contributes about $500 per hour to the firms profit and overhead. What is the probability that the new machine project will meet the firm’s NPV hurdle? Use Crystal Ball simulation to answer the question. Although this problem can be solved using different methods, we will be solving this using Crystal Ball. No pints will be awarded if you do not use the Crystal Ball.
0
(0 Ratings)
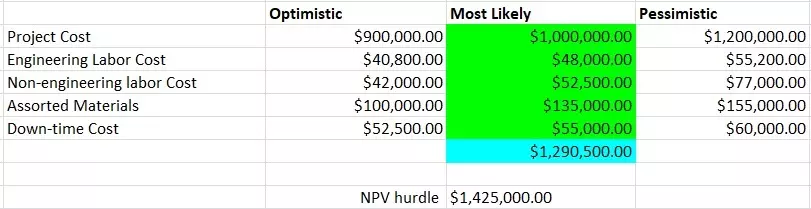
The first step is to determine the optimistic, most likely, and pessimistic values of the overall project and each of the sections of the project. For the project, the information is provided that;
The most likely estimated cost of the project itself is $1 million, but the most optimistic estimate is $900,000 while the pessimists predict a project cost of $1,200,000.
Hence:
Optimistic value = $900,000
Most likely value = $1, 000,000
Pessimistic value = $1, 200,000
For the other sections, use the information provided in part 2. For instance;
The engineering labor requirement has been estimated to be 600 hours, plus or minus 15% at a cost of $80 per hour.
Hence:
Optimistic value = [600 - (15% of 600)] × 80 = $40,800
Most likely value = 600 × 80 = $48,000
Pessimistic value = [600 + (15% of 600)] × 80 = $55,200
Use the same to calculate the other sections as show in the table below.
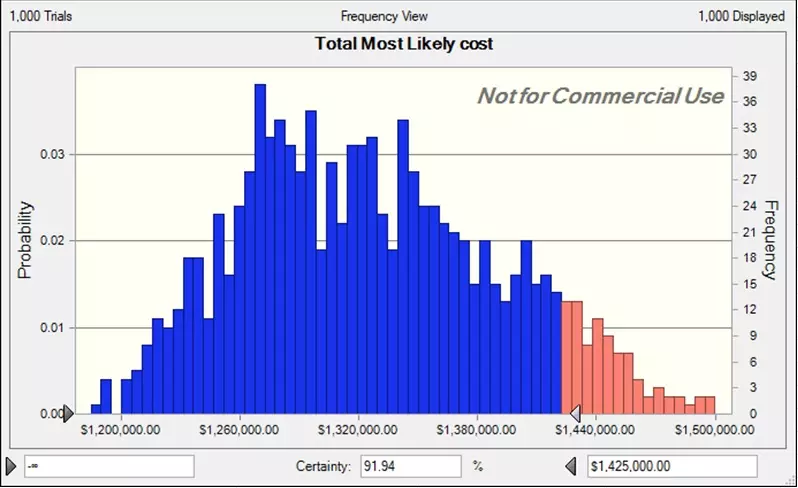
Feed the values into the Crystal Ball simulation using the Normal Distribution.
The project has a 91.94% chance of meeting the NPV hurdle
In this thought-provoking response, the author's perspective is skillfully backed by an extensive body of comprehensive research and readily available information, offering a well-informed and compelling exploration of the subject matter.
Questions Related to Project Schedule, Cost, and Resource Management
|
Your firm designs training materials for computer training classes, and you have just received a request to bid on a contract to produce a complete set of training manuals for an 8-session class. From previous experience, you know that your firm follows an 85% learning rate. For this contract, it appears that the effort will be substantial, running 50 hours for the first session....
1) List 5 Advantages and 5 Disadvantages of Matrix Project Organization. 2) Discuss how your management style might differ in a matrixed organization from the management style you might use in a project-oriented organization.
Stoneworth Paving Company specializes in highway paving jobs for state of Virginia. When the State first awarded Stoneworth the contract, they stipulated a 1% penalty for each week Stoneworth was late on a completion date. Preston Flintrock, the project coordinator for Stoneworth, began to notice that the last two jobs were three weeks late, and the paving job that was due to be completed in the next two weeks was behind schedule. ...
The following project is at the end of its 6th week. Find the cost and schedule variances. Also find the CPI and SPI. Then find the critical ratio of the project using earned value calculations. Finally, calculate the EAC for the project by at least two different methods.
A project has just completed its 87th item in the project plan. It was scheduled to have spent $300,000 at this point in the plan, but has actually spent only $250,000. The project manager estimates that the value of the work actually finished is nearly $200,000. What are the spending and schedule variances for the project? What are the SPI and CPI? What is the Critical Ratio?
A project in its 26th week has an actual cost of $300,000. It was scheduled to have completed $325,000 worth of work at that point in the project. For the work performed to date, the budgeted value is $350,000. The project has a total budget of $500,000. What are the cost and schedule variances for the project? What are the SPI and CPI? Assuming that both schedule and cost variances will affect the remaining work, what is the EAC?